Title:
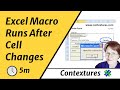
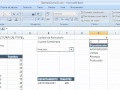
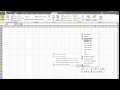
Excel VBA - Click Column Heading to Quickly Sort Table
Video:
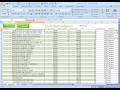
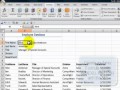
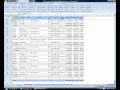
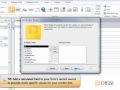
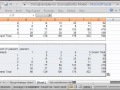
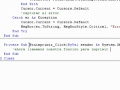
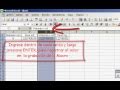
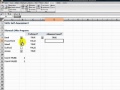
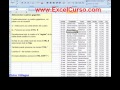
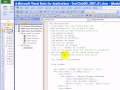
Description:www.contextures.com Add invisible rectangles at the top of Excel columns. Users click the heading to sort by that column. If the column is currently in ascending order, the macro will sort in descending order. This Excel tutorial video shows you how to edit and run the macro to set up the hidden rectangles. After that one-time job, just click on a heading, to run the Sort Table macro.
Published:
31/Oct/2010
Excel VBA - Click Column Heading to Quickly Sort Table
Video:
Description:www.contextures.com Add invisible rectangles at the top of Excel columns. Users click the heading to sort by that column. If the column is currently in ascending order, the macro will sort in descending order. This Excel tutorial video shows you how to edit and run the macro to set up the hidden rectangles. After that one-time job, just click on a heading, to run the Sort Table macro.
Published:
31/Oct/2010