Title:
Excel Magic Trick 744: Break Even Analysis Formulas Chart and Plotting Break Even Point On Chart
Video:
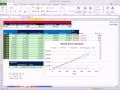
Description:Download file: people.highline.edu See how to do Break Even Analysis Table with Formulas, Chart (Xy Scatter Chart Diagram), and Conditional Formatting with a Logical Formula (True False Formula) and Mixed Cell References. Also See a Formula and charting trick to show the approximate Break Even Point on the Chart. Accounting Break Even Analysis Excel. Managerial Accounting Cost Accounting Fixed Cost Variable Cost Accounting Contribution Margin Accounting Class Break Even Analysis XY Scatter Diagram Chart Line Chart Finance Break Even.
Published:
08/Dec/2010
Excel Magic Trick 744: Break Even Analysis Formulas Chart and Plotting Break Even Point On Chart
Video:
Description:Download file: people.highline.edu See how to do Break Even Analysis Table with Formulas, Chart (Xy Scatter Chart Diagram), and Conditional Formatting with a Logical Formula (True False Formula) and Mixed Cell References. Also See a Formula and charting trick to show the approximate Break Even Point on the Chart. Accounting Break Even Analysis Excel. Managerial Accounting Cost Accounting Fixed Cost Variable Cost Accounting Contribution Margin Accounting Class Break Even Analysis XY Scatter Diagram Chart Line Chart Finance Break Even.
Published:
08/Dec/2010
No comments:
Post a Comment